Three agents are running and the fans just took off.
See every project on your Mac, the coding agent working in it, the dev servers it started and how hard it’s working. Claude Code, Codex and Cursor are recognised by their real command path.
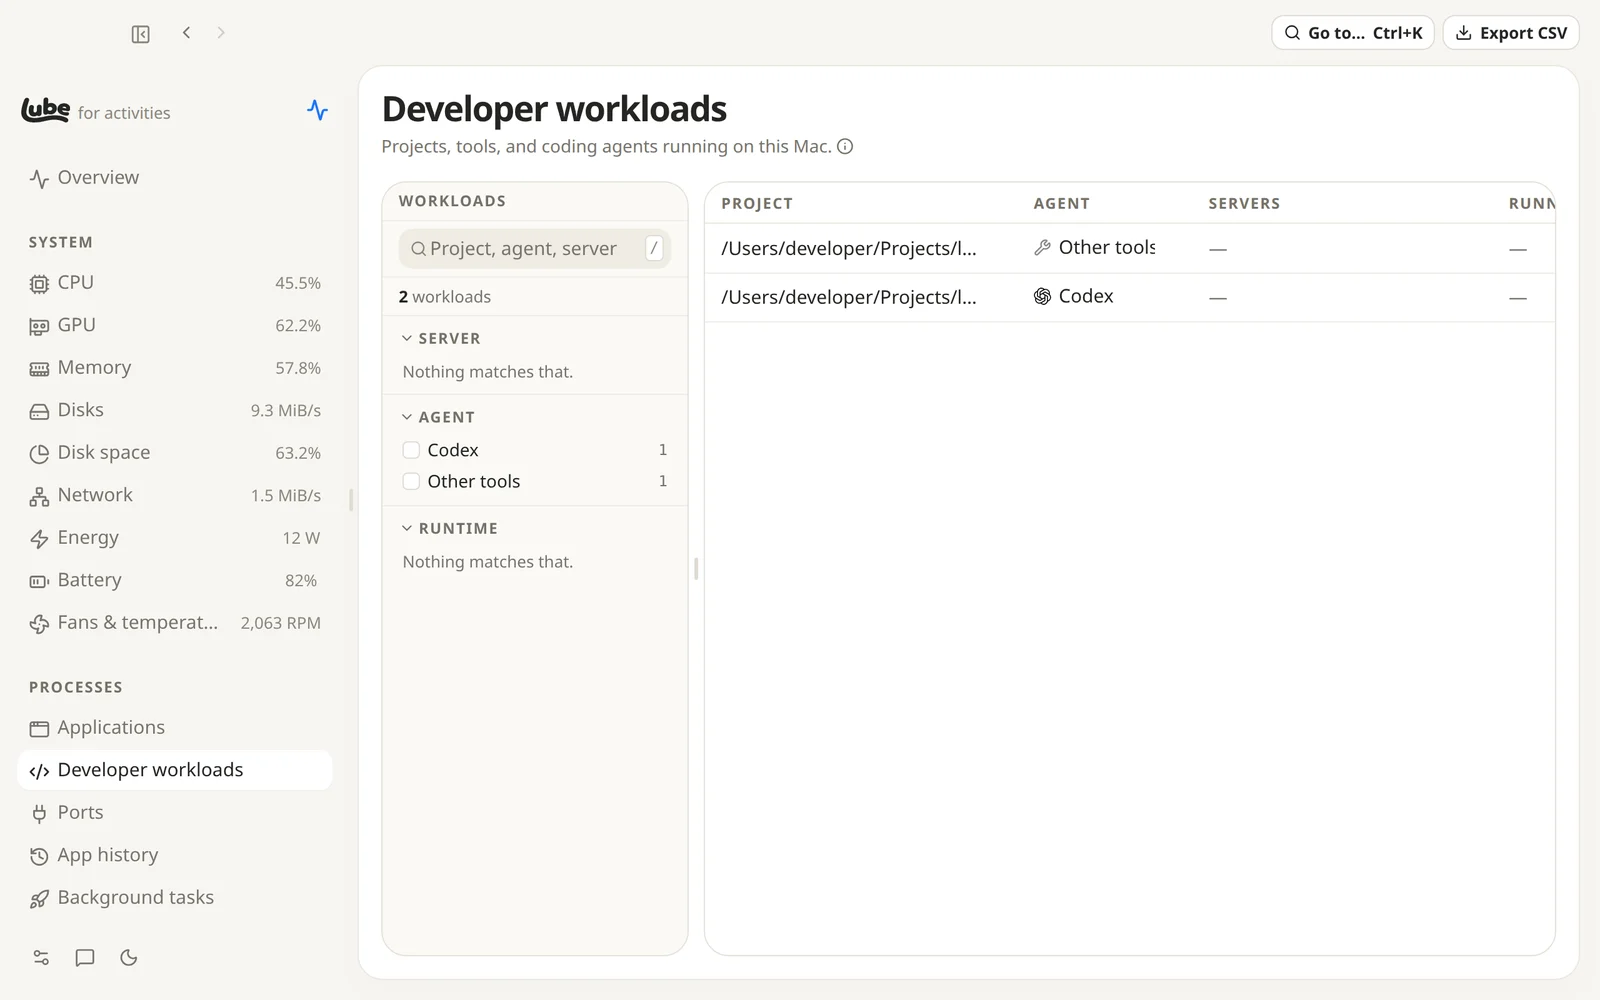

Lube Activity Monitor shows which agent is busy in each project, the dev servers and ports it left behind, and what’s filling your disk. Plus every CPU core, GPU, memory and fans, from a window or the menu bar.
See every project on your Mac, the coding agent working in it, the dev servers it started and how hard it’s working. Claude Code, Codex and Cursor are recognised by their real command path.
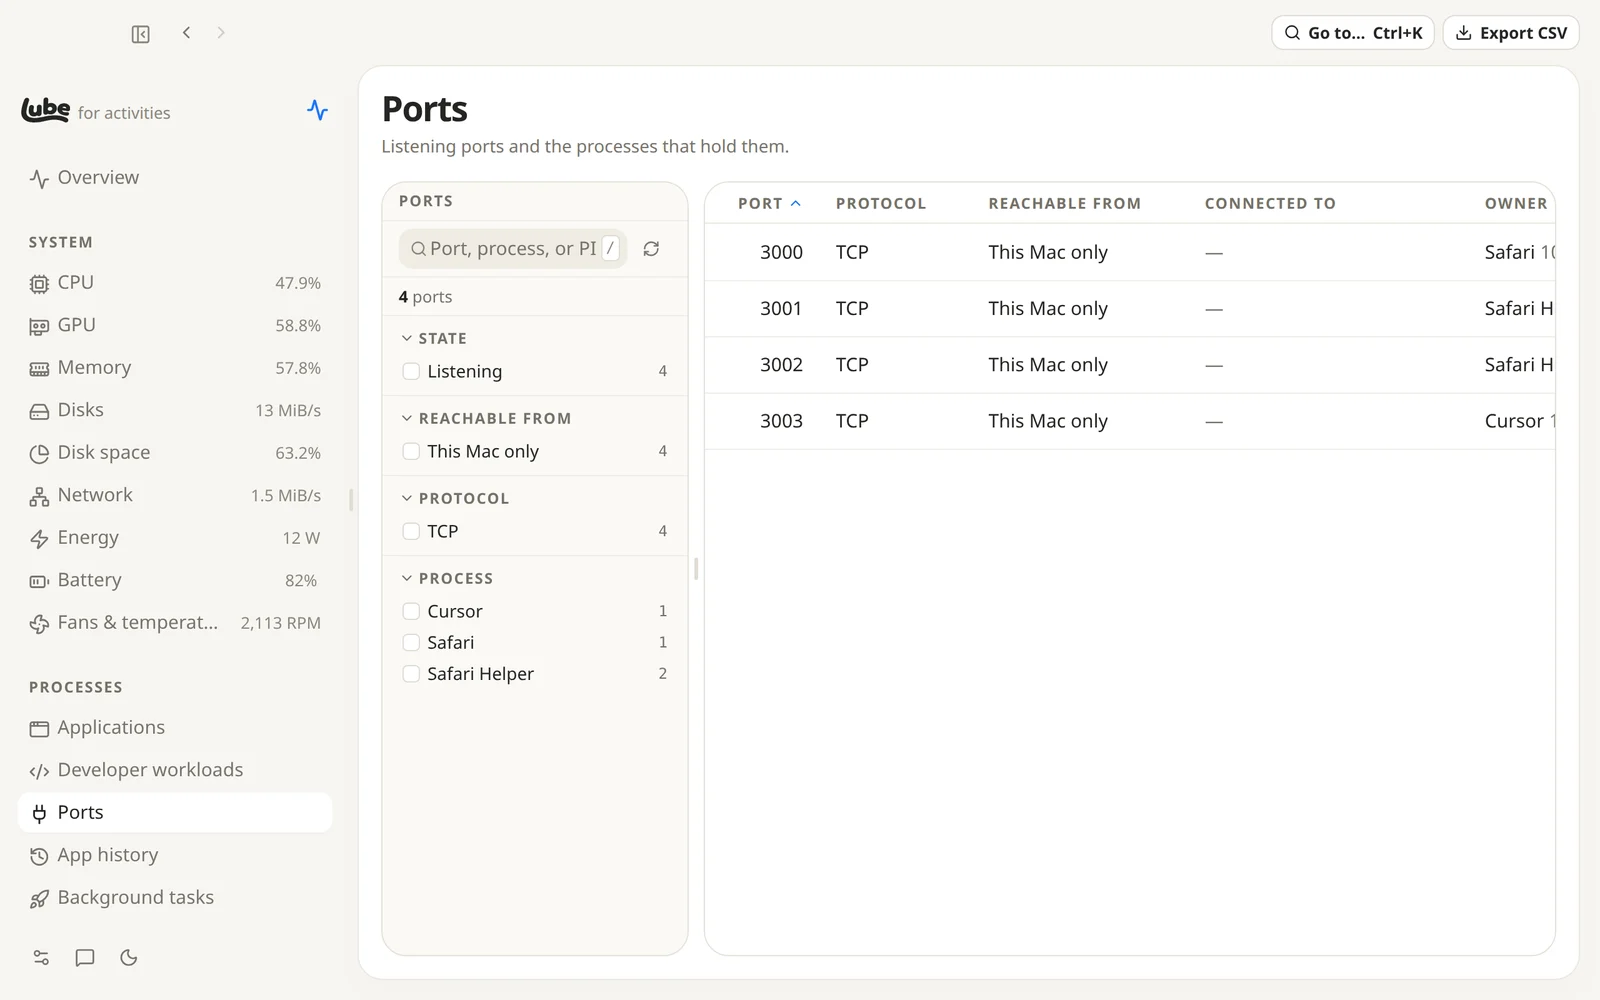
See which process holds every listening port and who can reach it, then stop the one in your way.
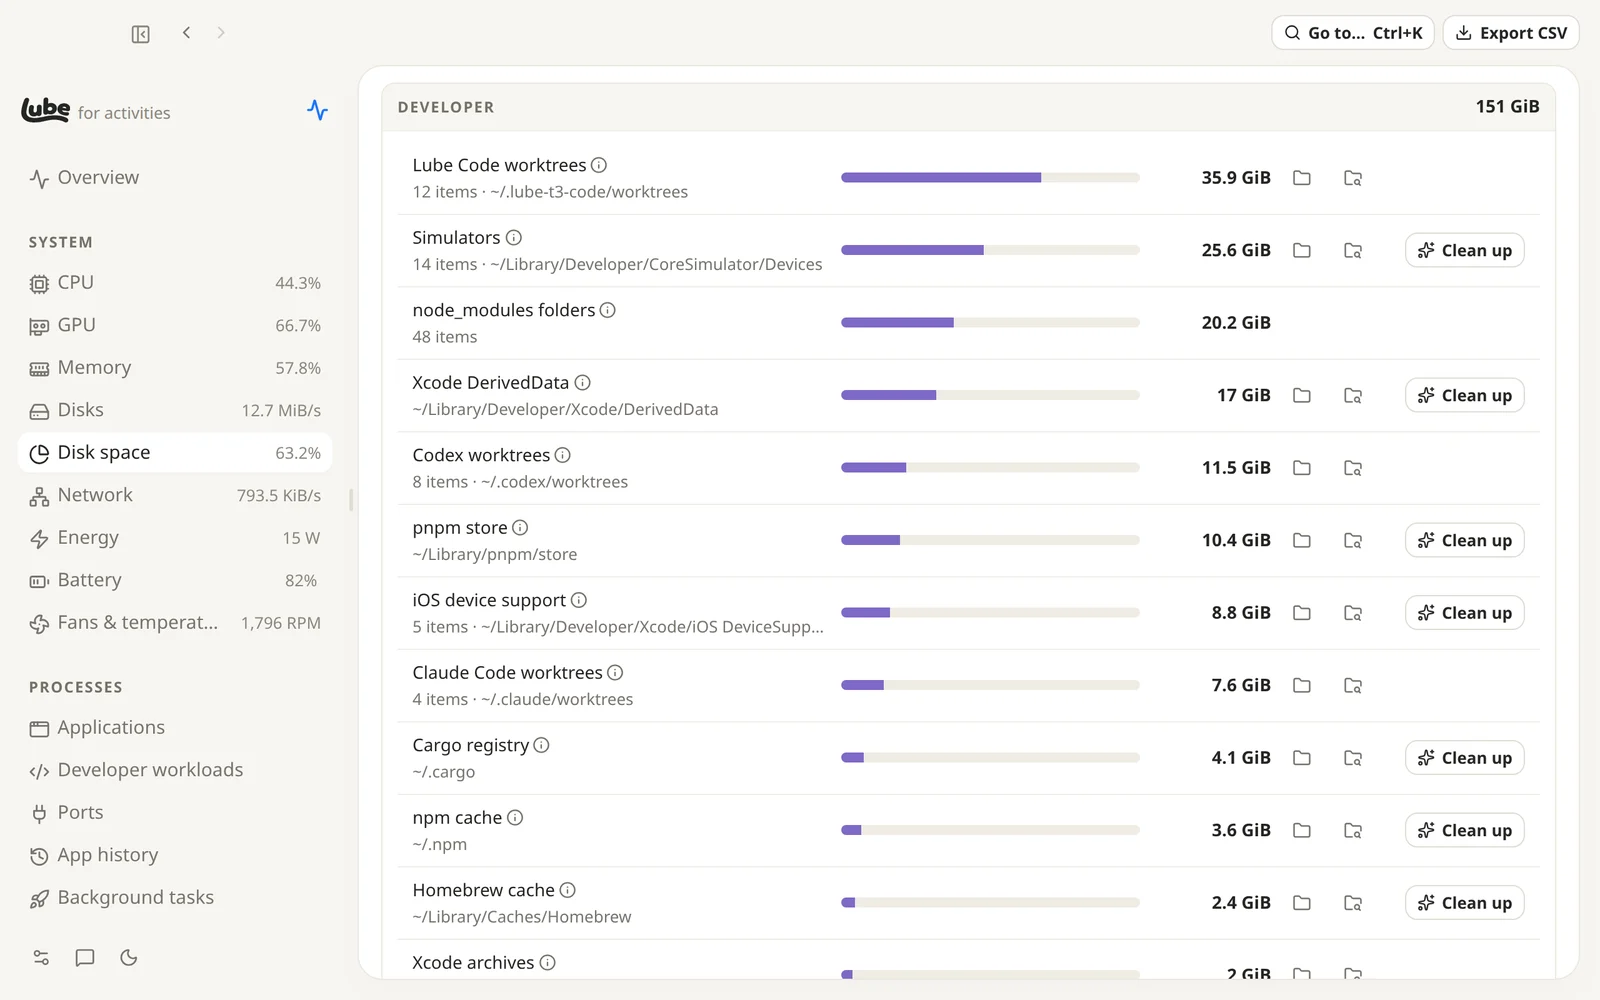
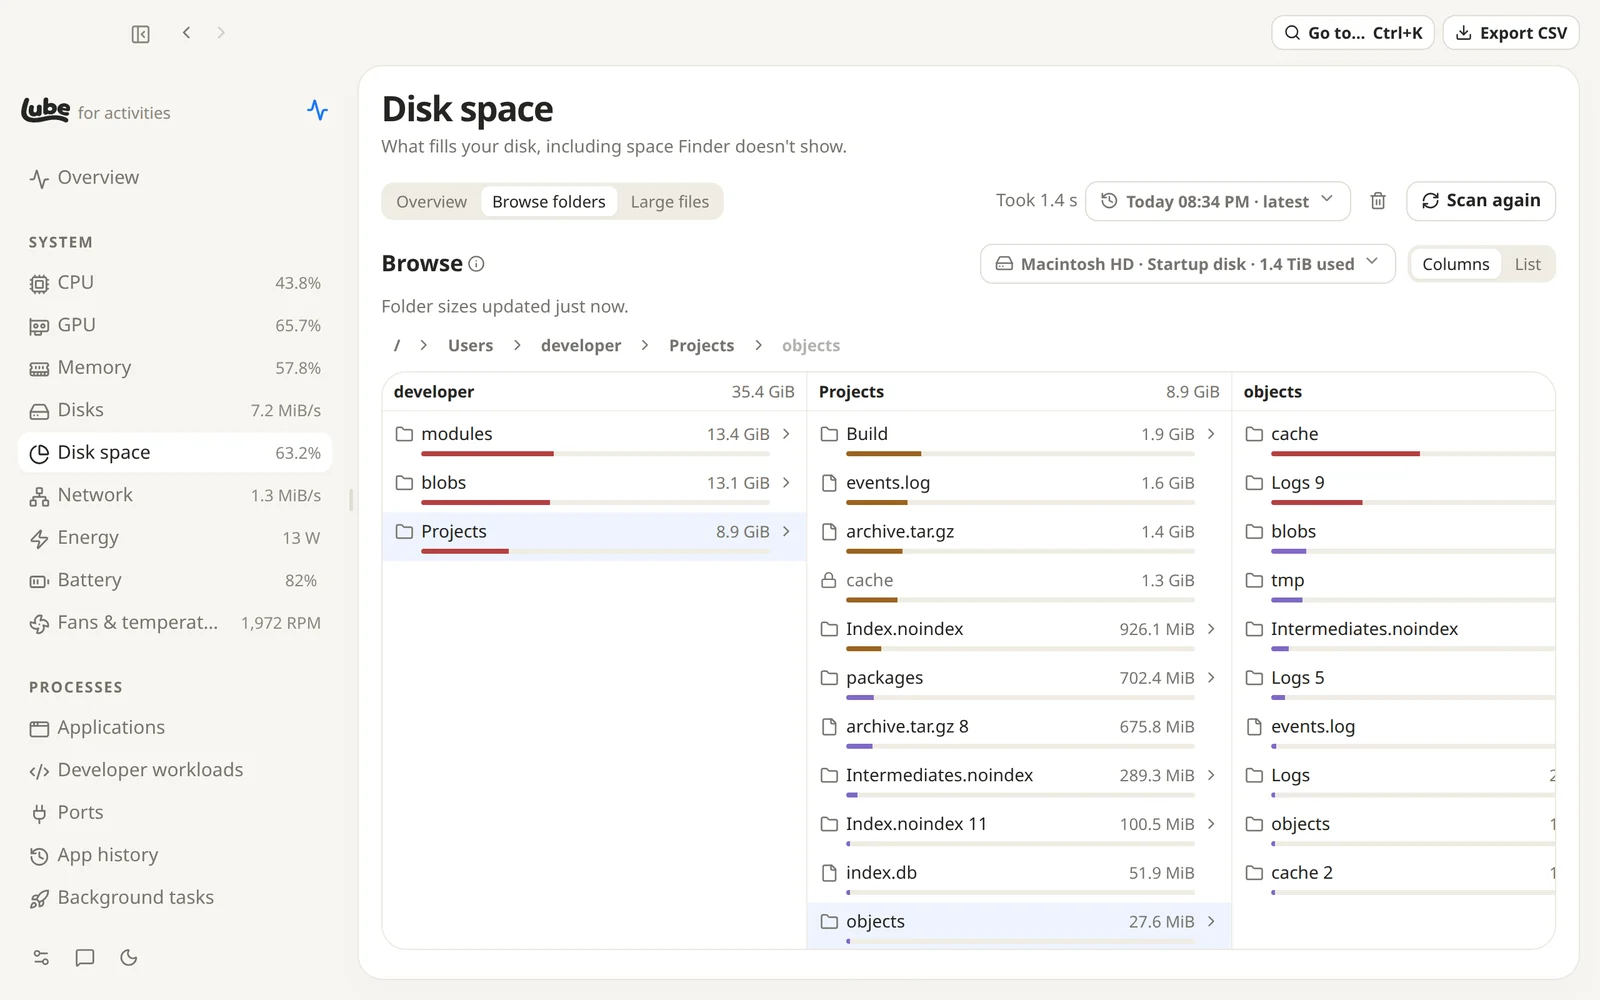
Scan your disk and see what’s taking the space, including what Finder doesn’t show: the worktrees Claude Code, Codex and Cursor leave behind, node_modules, Xcode data and Docker. Clean up from the list, or browse any folder by size.
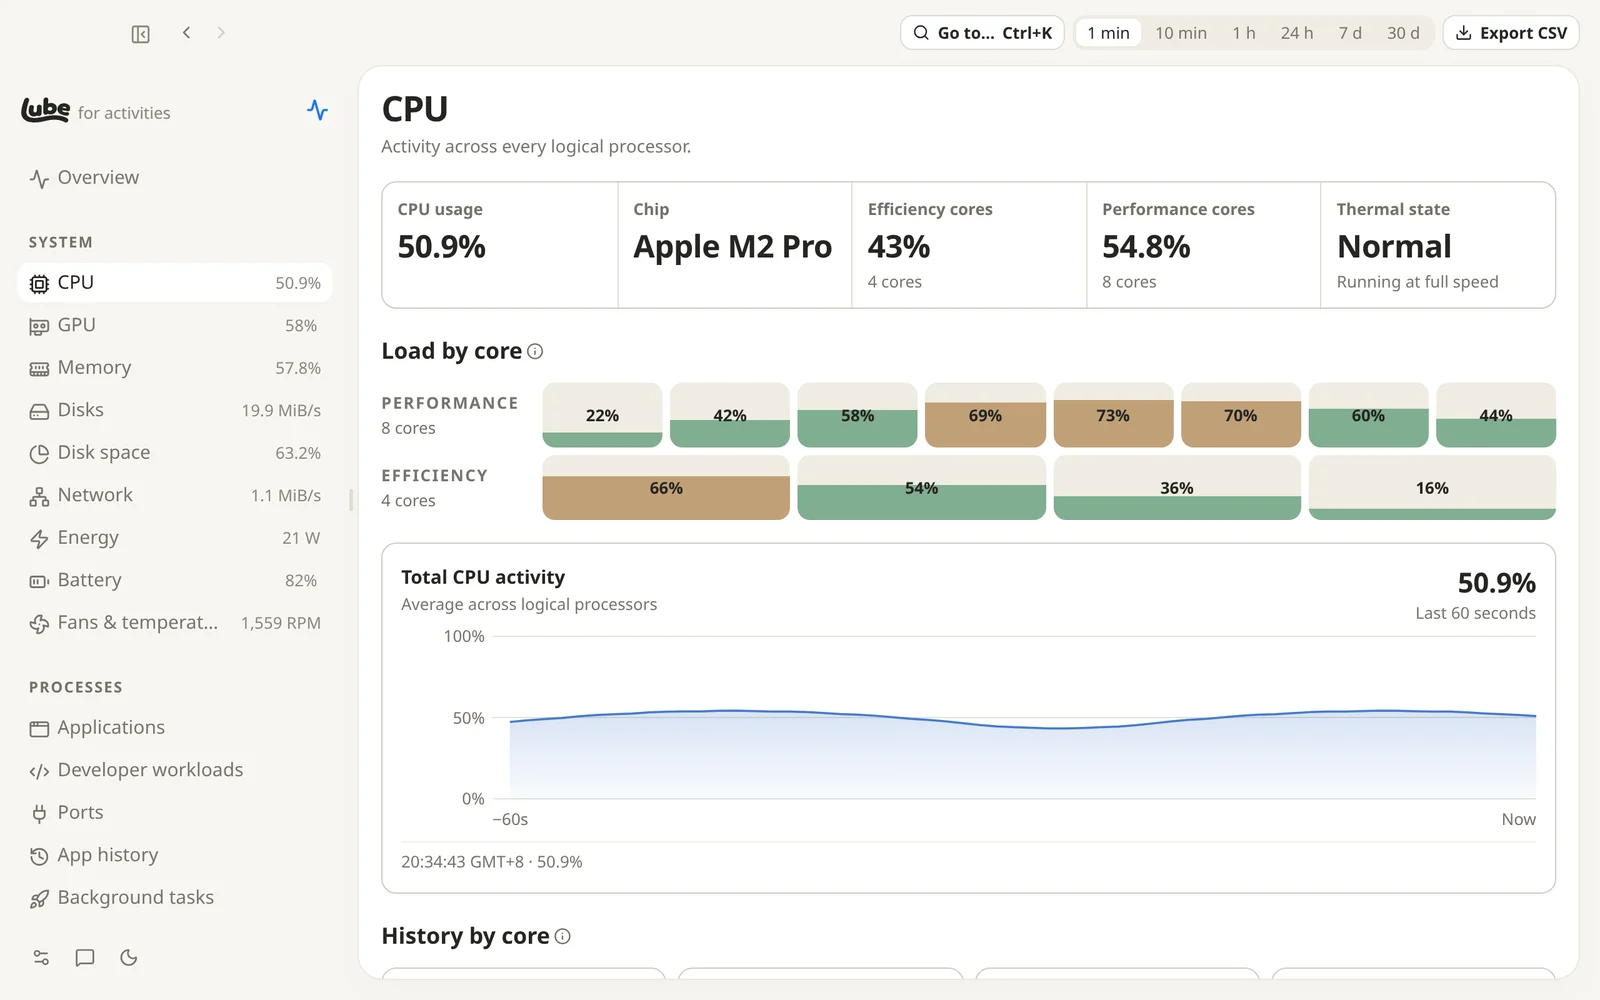
See the load on every performance and efficiency core, live, with your chip and whether it’s throttling.
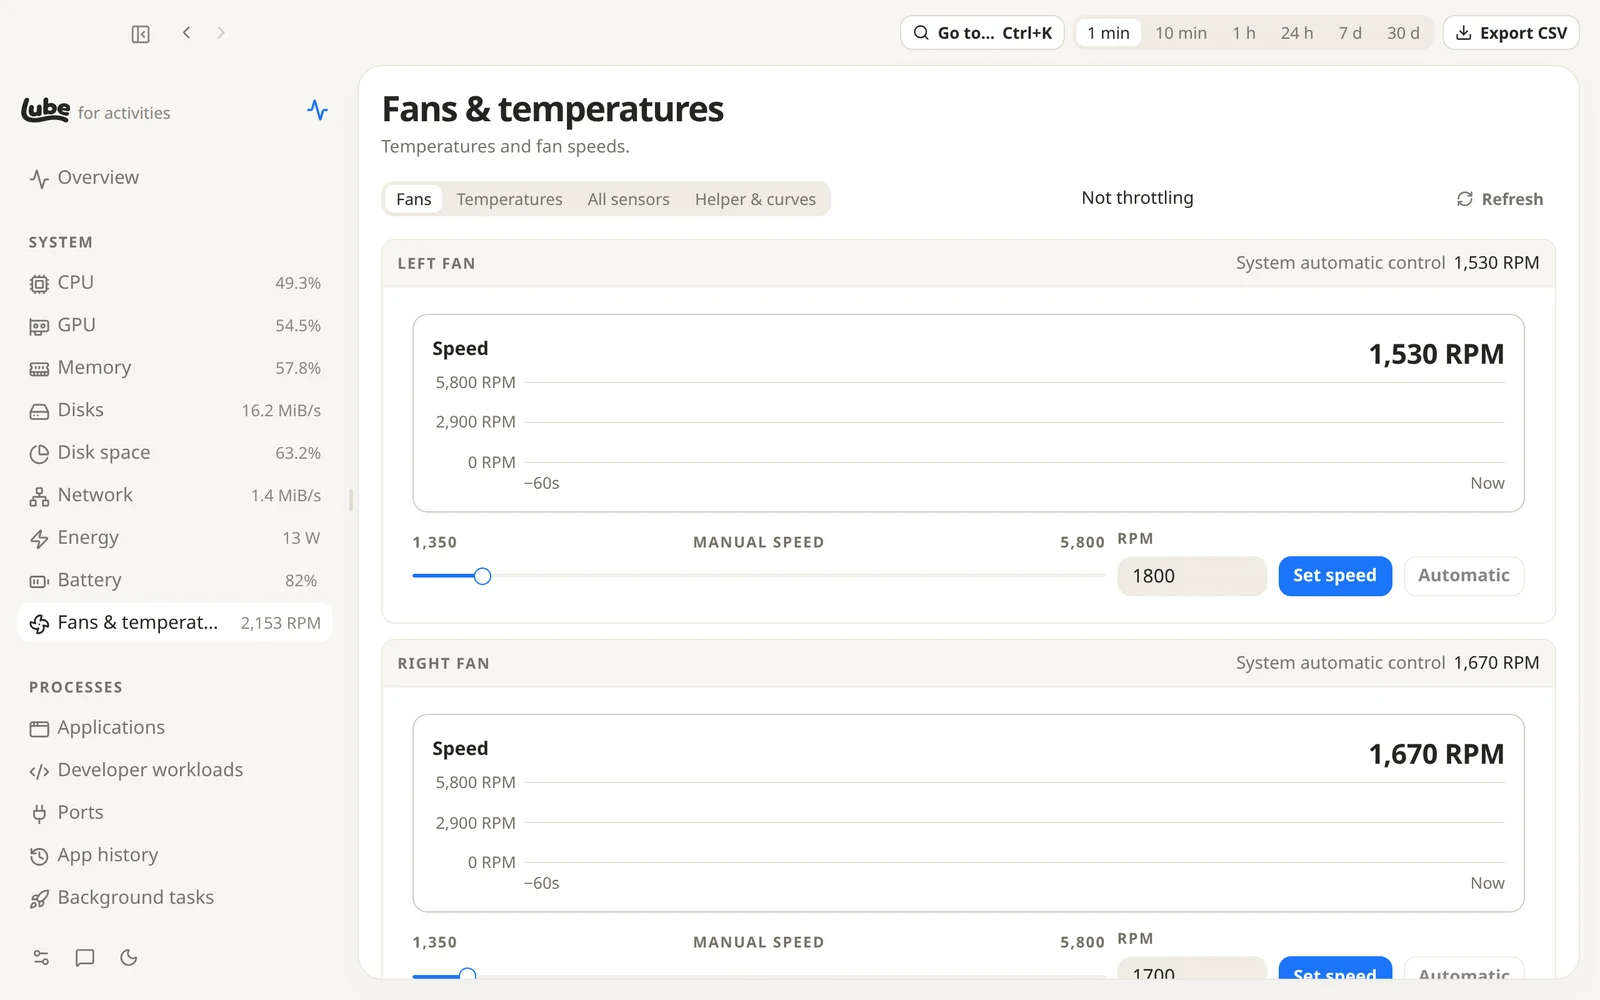
Set your own fan speeds with RPM targets, curves across several sensors, and different profiles plugged in or on battery.
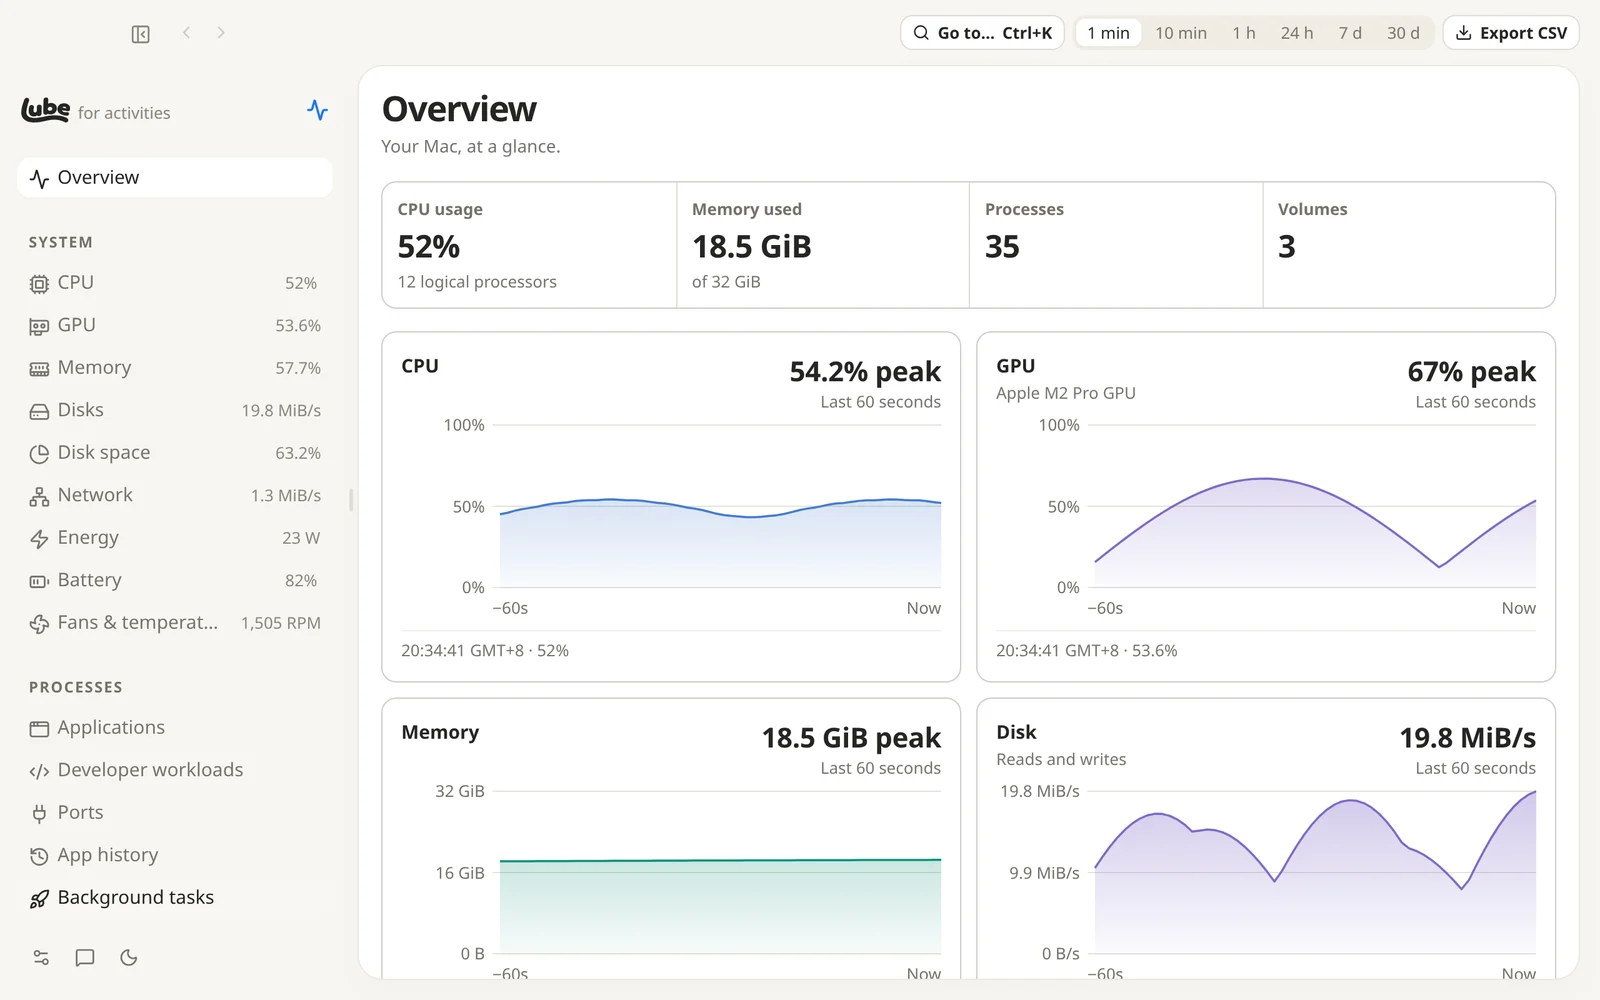
Live CPU, GPU, memory, disks and network, from a window or the menu bar. Get an alert when CPU or memory stays high, even with the window closed.
Find out what your agents have been up to.